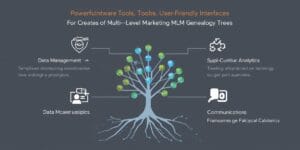
MLM distributors and network marketers need clear ways to track their growing organizations and spot opportunities for expansion. A genealogy tree in MLM serves as your visual roadmap, showing exactly how your downline connects and where your biggest growth potential lies. This powerful mapping system helps you understand your company network marketing structure at a glance.
This guide is designed for MLM distributors, team leaders, and network marketing professionals who want to build stronger, more profitable organizations. Whether you’re managing a small team or overseeing hundreds of distributors, these visualization techniques will transform how you approach your business.
We’ll explore the essential elements that make up effective MLM genealogy tree structures, so you know exactly what information to track and display. You’ll also discover the best tools and software options available for creating professional genealogy trees that actually help you make better business decisions. Finally, we’ll show you how to analyze your visual network maps strategically, turning your tree into a growth-driving machine that reveals untapped opportunities in your downline.
Understanding Genealogy Trees in MLM Business Models

Core concepts of network genealogy visualization
A Genealogy Tree in MLM represents the visual structure of your network marketing organization, showing how distributors connect through recruitment and mentorship relationships. Unlike traditional organizational charts, these trees branch horizontally and vertically to display the multi-level nature of your downline.
The foundation of network genealogy visualization centers on three primary elements: sponsors (upline), distributors (you), and recruits (downline). Each node on the tree represents an individual distributor, while connecting lines show direct sponsorship relationships. This creates a clear picture of how your company network marketing structure flows from top to bottom.
Network genealogy trees operate on placement rules that vary by compensation plan. Binary trees limit each distributor to two direct recruits, forcing additional members into deeper levels. Unilevel structures allow unlimited width on the first level, creating broader but potentially shallower trees. Matrix plans combine both restrictions, limiting both width and depth at each level.
The visual representation includes essential data points like enrollment dates, rank achievements, sales volumes, and commission flows. Color coding often distinguishes active from inactive distributors, while different symbols might represent various membership levels or qualification statuses.
Difference between traditional family trees and MLM structures
Traditional family trees trace biological or legal relationships through generations, moving strictly downward from ancestors to descendants. Each person appears only once, connected to biological parents through fixed relationships that never change.
MLM genealogy trees function differently. Distributors can sponsor multiple people simultaneously, creating instant “families” of varying sizes. The relationships are business-based rather than biological, formed through recruitment activities and mentorship agreements.
| Traditional Family Trees | MLM Genealogy Trees |
| Fixed bloodline relationships | Flexible business relationships |
| One set of parents per person | Multiple levels of mentorship |
| Historical documentation | Real-time network tracking |
| Static structure | Dynamic, growing structure |
| Generations span decades | Levels can form instantly |
Family trees grow slowly over generations, while MLM structures can expand rapidly within months or weeks. A single active distributor might personally sponsor dozens of people in their first year, creating an immediate multi-level structure that would take a traditional family several generations to achieve.
The data tracked also differs significantly. Family trees focus on names, dates, locations, and relationships. MLM trees monitor sales performance, commission earnings, rank progressions, and team building activities that directly impact your business success.
Key components of downline mapping
Effective downline mapping requires tracking specific components that reveal your network’s health and growth potential. Personal volume represents individual sales activity, while group volume shows the combined efforts of entire teams. These metrics help identify productive branches versus struggling segments.
Sponsorship lines create the backbone of your genealogy tree, showing who recruited whom and when. Direct sponsorship connects you to your immediate recruits, while indirect relationships extend through multiple levels. Understanding these connections helps you provide targeted support where needed most.
Geographic distribution adds another layer to downline mapping. Plotting member locations reveals market penetration patterns and identifies untapped territories. Some regions might show dense concentration while others remain completely open for expansion.
Activity levels distinguish engaged distributors from inactive members. Recent login dates, training completion, and sales activity paint a clear picture of who’s actively building versus who might need re-engagement efforts. This information guides your coaching priorities and resource allocation.
Rank progression tracking shows advancement patterns throughout your organization. Identifying distributors approaching rank requirements helps you provide timely support for breakthroughs that benefit everyone in their upline.
Benefits of visual representation for network marketers
Visual genealogy trees transform complex network data into instantly understandable formats. Instead of scanning through spreadsheets or reports, you can quickly spot growth patterns, identify gaps, and recognize opportunities with a single glance at your tree structure.
Pattern recognition becomes intuitive with visual mapping. Strong-performing legs stand out through color coding or size indicators, while struggling branches become obvious candidates for additional support. This immediate visual feedback accelerates decision-making and strategy adjustments.
Team presentations benefit enormously from genealogy tree visuals. New recruits understand their position and potential more clearly when they see where they fit within the larger organization. Recognition events become more meaningful when achievements are displayed within the context of team growth.
Goal setting improves when distributors can visualize their current position and desired growth. Seeing exactly how many additional recruits or what volume increases are needed for the next rank makes targets feel more achievable and concrete.
Communication flows more effectively through visual structures. Instead of explaining complex relationships verbally, you can point to specific branches, levels, or connections on the tree. This reduces confusion and ensures everyone understands their role within the larger network.
Training becomes more targeted when you can identify specific skill gaps or support needs through visual analysis. Distributors struggling with depth building versus width expansion become clear, allowing you to customize coaching approaches for maximum impact.
Essential Elements of MLM Genealogy Tree Structure

Parent-child relationship dynamics in networks
The backbone of any genealogy tree in MLM lies in understanding how parent-child relationships function within network structures. Think of it like a family tree where each person has a direct sponsor (parent) and can recruit others (children) beneath them. The sponsor-recruit connection forms the foundation of all MLM compensation plans and determines how commissions flow through the network.
Each distributor in a company network marketing structure maintains specific responsibilities toward their downline. The parent node serves as mentor, trainer, and support system for their direct recruits. This relationship creates accountability chains that strengthen the entire network. When a sponsor actively supports their team members, the ripple effect boosts performance across multiple generations.
Parent-child dynamics also determine commission structures and bonus eligibility. Most MLM systems calculate overrides based on the performance difference between sponsors and their direct recruits. Strong parent-child relationships often correlate with higher retention rates and improved team productivity.
Generation levels and depth tracking
MLM genealogy trees organize distributors into distinct generation levels that help visualize network depth and earning potential. The first generation includes all personally sponsored distributors, while the second generation encompasses everyone recruited by first-generation members.
Generation tracking serves multiple purposes:
- Commission calculations: Most plans pay different percentages based on generation depth
- Leadership qualification: Many companies require specific volumes across multiple generations
- Growth analysis: Teams can identify which levels need strengthening
- Compliance monitoring: Helps ensure balanced growth patterns
| Generation Level | Description | Typical Commission Range |
| 1st Generation | Direct recruits | 5-25% |
| 2nd Generation | Recruits of recruits | 3-15% |
| 3rd Generation | Third level down | 2-10% |
| 4th+ Generations | Deeper levels | 1-5% |
Tracking generation depth reveals important patterns about network health. Networks with strong performance across 4-6 generations typically demonstrate sustainable growth models.
Volume and performance indicators integration
Modern MLM genealogy trees incorporate real-time volume tracking and performance metrics directly into the visual structure. This integration transforms static organizational charts into dynamic business intelligence tools.
Key performance indicators include:
- Personal volume: Individual sales and purchases
- Group volume: Combined team production
- Active distributor counts: Members meeting minimum requirements
- Rank advancement tracking: Progress toward leadership levels
- Retention rates: Percentage of active members over time
Visual indicators use color coding, sizing, and symbols to represent different performance levels. High-performing branches might display in green with larger node sizes, while struggling areas appear in red with smaller representations. This immediate visual feedback helps leaders identify opportunities and challenges at a glance.
Volume integration also enables predictive analytics. By analyzing historical patterns, leaders can forecast future growth trends and adjust strategies accordingly. Teams can spot emerging leaders early and provide additional support where needed.
Performance dashboards linked to genealogy trees create comprehensive management tools. Leaders access detailed drill-down capabilities while maintaining the big-picture perspective that visual trees provide. This combination of depth and breadth makes genealogy trees indispensable for serious MLM professionals.
Powerful Tools and Software for Creating MLM Genealogy Trees

Professional MLM Software Platforms with Genealogy Features
Dedicated MLM software platforms offer the most comprehensive solutions for creating detailed genealogy trees in company network marketing. These platforms provide specialized features that go beyond basic visualization, including real-time data synchronization, commission tracking, and performance analytics.
Top-tier platforms like MLM Vibes, Infinite MLM, and Pro MLM offer sophisticated genealogy tree builders with drag-and-drop functionality. These systems automatically populate member information, sales data, and recruitment patterns, creating dynamic visual representations that update in real-time. Users can zoom in on specific branches, filter by performance metrics, and generate reports directly from the genealogy view.
Key features include multi-level viewing capabilities, customizable node designs, and integration with payment processing systems. Many platforms support various compensation plans (binary, unilevel, matrix) and automatically adjust the genealogy tree structure accordingly. Advanced platforms also offer mobile responsiveness and white-label customization options for companies wanting to maintain their brand identity.
Investment considerations range from $50-500 monthly for professional platforms, depending on member capacity and feature sets. While the cost may seem significant, these tools typically pay for themselves through improved team management efficiency and better strategic decision-making capabilities.
Free and Budget-Friendly Visualization Alternatives
Several cost-effective options exist for creating genealogy trees in MLM without breaking the budget. These alternatives work particularly well for new distributors or small teams testing different visualization approaches before investing in premium solutions.
Lucidchart stands out as a versatile diagramming tool offering MLM-friendly templates. The free version supports up to 60 objects per diagram, sufficient for small to medium-sized downlines. Users can create professional-looking genealogy trees with color-coding for different performance levels and easy sharing capabilities.
Draw.io (now diagrams.net) provides completely free online diagramming with no user limits. While lacking MLM-specific features, it offers extensive customization options and integrates well with Google Drive and other cloud storage solutions. The learning curve is minimal, making it accessible for team members with varying technical skills.
Canva offers genealogy tree templates that can be adapted for MLM purposes. Though originally designed for family trees, these templates work well for network visualization when customized with member photos, rank achievements, and performance indicators.
Google Drawings provides basic but functional tree creation capabilities directly within the Google ecosystem. The collaboration features allow team members to contribute updates and modifications in real-time, making it ideal for growing networks that need constant updates.
Custom Spreadsheet Solutions for Small Teams
Spreadsheet applications like Excel and Google Sheets can be transformed into powerful genealogy tree visualization tools with the right approach. These solutions offer maximum flexibility and complete data control while maintaining familiar interfaces that most team members already understand.
Excel’s SmartArt feature enables quick genealogy tree creation with professional styling options. Users can input member data into connected shapes, apply consistent formatting, and create hierarchical structures that clearly show reporting relationships. Advanced users can incorporate formulas that automatically calculate team volumes, commissions, and growth rates directly within the visual representation.
Google Sheets offers collaborative advantages through real-time editing and sharing capabilities. Multiple team members can update their sections simultaneously, ensuring accuracy and reducing maintenance workload. Conditional formatting can highlight top performers, new recruits, or members needing attention using color-coded systems.
Template customization allows teams to create standardized formats including member photos, contact information, join dates, and performance metrics. These spreadsheets can generate summary statistics and export data for use in other applications or presentations.
Data validation features prevent errors and maintain consistency across the genealogy tree. Dropdown menus for ranks, status indicators, and performance levels ensure uniform data entry while reducing the chance of mistakes that could affect compensation calculations.
Mobile Apps for On-the-Go Network Tracking
Mobile applications have revolutionized how MLM professionals manage their genealogy trees, providing instant access to network information regardless of location. These apps enable real-time updates, quick member lookups, and immediate response capabilities during field activities.
MLM Mobile by various providers offers dedicated genealogy tree apps with touch-friendly interfaces optimized for smartphones and tablets. Users can navigate through their entire network structure using intuitive gestures, zoom into specific branches, and access detailed member profiles with a single tap.
Hybrid solutions combine mobile apps with web-based platforms, ensuring data synchronization across all devices. Changes made on mobile devices instantly reflect in desktop versions and vice versa, maintaining consistency for teams working across multiple platforms.
Key mobile features include offline access capabilities, push notifications for important network events, and GPS integration for mapping member locations. Many apps support photo capture for member profiles, voice notes for follow-up reminders, and quick messaging directly from the genealogy tree interface.
Security considerations remain paramount with mobile solutions. Leading apps implement encryption, secure authentication, and automatic logout features to protect sensitive network information. Backup and restore capabilities ensure data preservation even if devices are lost or damaged.
Popular options include MyEcon, ByDzyne Mobile, and various company-specific applications. These tools typically integrate with existing MLM software platforms while providing enhanced mobility for active field leaders who need constant access to their genealogy tree structure and member information.
Strategic Growth Analysis Through Visual Network Mapping

Identifying high-performing branches and weak spots
Visual network mapping transforms your Genealogy Tree in MLM into a powerful diagnostic tool that reveals performance patterns across your entire organization. When you color-code your tree based on sales volume, recruitment success, or activity levels, strong performers immediately stand out as bright spots while struggling areas appear as darker regions.
Top-performing branches typically share common characteristics: consistent monthly sales, regular team meetings, and active mentoring programs. These branches often display a balanced growth pattern with both depth and width in their structure. Weak spots, on the other hand, show telltale signs like single-leg development, inactive members clustered together, or sudden dropoffs after initial recruitment bursts.
Smart leaders create heat maps of their genealogy trees, updating them monthly to track changes. Red zones indicate urgent attention needed, yellow areas suggest moderate support requirements, and green sections represent self-sustaining growth engines. This visual approach helps you allocate your time and resources where they’ll make the biggest impact.
Tracking recruitment patterns and success rates
Your genealogy tree reveals fascinating recruitment patterns when you analyze the data systematically. Some distributors excel at recruiting friends and family but struggle with strangers, while others thrive in professional networking environments but can’t convert personal contacts.
Successful company network marketing leaders track several key metrics through their visual trees:
- Recruitment velocity: How quickly new members join each branch
- Conversion ratios: Percentage of prospects who actually sign up
- Retention rates: How long new recruits stay active in the business
- Spillover effectiveness: Success rates of members placed by upline sponsors
By mapping recruitment sources directly onto your genealogy tree, you can identify which approaches work best for different personality types and backgrounds. This data helps you customize training programs and recruitment strategies for each branch of your organization.
Measuring team depth versus width optimization
The eternal MLM debate centers on whether to build deep (focusing on a few strong legs) or wide (recruiting many first-level distributors). Your genealogy tree visualization makes this decision crystal clear by showing actual performance data rather than theoretical projections.
| Strategy | Advantages | Disadvantages | Best For |
| Deep Building | Strong team culture, easier management | Higher risk if key leaders quit | Experienced networkers |
| Wide Building | Risk distribution, more leadership opportunities | Diluted attention, harder to manage | New distributors |
| Hybrid Approach | Balanced risk and growth | Requires advanced skills | Seasoned professionals |
Most successful distributors discover their optimal balance through experimentation, using their genealogy tree to track which approach generates better long-term results. The tree shows you where adding depth strengthens weak legs and where expanding width creates new growth opportunities.
Spotting potential leadership candidates in your downline
Your genealogy tree acts like a talent scout, revealing future leaders before they even recognize their own potential. Look for distributors who naturally attract others, maintain consistent personal sales, and show up regularly to team events. These individuals often appear as natural clustering points in your tree visualization.
Leadership indicators become obvious when you study your tree’s growth patterns:
- Magnetic personalities: People who consistently attract new recruits without heavy promotion
- Steady performers: Distributors maintaining consistent sales and activity over multiple months
- Natural mentors: Those whose downline shows higher-than-average retention rates
- Growth catalysts: Individuals whose presence accelerates entire branch performance
Early identification allows you to invest extra training and support in these emerging leaders, creating a multiplier effect throughout your organization. The genealogy tree helps you spot these diamonds in the rough by highlighting unusual growth patterns and performance metrics that might otherwise go unnoticed.
Maximizing Downline Potential Using Genealogy Tree Insights

Strategic placement of new recruits for maximum impact
Smart placement strategies in your genealogy tree can make or break your MLM success. When you bring in new recruits, where you position them determines how effectively your compensation plan works and how balanced your network stays.
Start by analyzing weak spots in your current structure. Look for legs that are underperforming or areas where your team needs more support. Placing strong recruits in these positions creates stability and helps struggling areas gain momentum. Power legs often benefit from adding new members who can become leaders themselves, but don’t neglect your weaker branches.
Consider the spillover effect when making placement decisions. Some company network marketing plans reward you when your upline places recruits below you. Position yourself to benefit from these spillovers by maintaining active legs that can receive new members. Keep communication open with your upline about their placement strategies.
Match recruit strengths with placement needs. Natural leaders work best at the top of weak legs, while part-time participants might fit better in already-strong branches where they can benefit from existing momentum without pressure to lead.
Track placement results using your genealogy tree software. Monitor how different positioning strategies affect your team’s growth patterns and adjust your approach based on what works best for your specific compensation structure.
Balancing team development across all legs
Balanced development prevents your genealogy tree from becoming lopsided and ensures sustainable growth across your entire network. Many MLM distributors make the mistake of focusing only on their strongest performers while neglecting other legs, creating unstable structures that limit long-term earning potential.
Regular monitoring helps identify imbalances early. Check your genealogy tree weekly to spot legs that are falling behind. Look at metrics like recruitment rates, sales volumes, and leadership development across different branches. Create a simple tracking system that flags legs needing attention.
Resource allocation plays a crucial role in maintaining balance. Divide your time and effort proportionally among all active legs, not just the ones showing immediate promise. Sometimes a leg that seems slow to develop contains future leaders who need extra support to reach their potential.
Cross-pollination strengthens weaker areas by connecting them with successful team members from other legs. Organize team calls that include members from different branches, allowing them to share strategies and motivation. This approach builds unity while helping struggling areas learn from top performers.
Set realistic timelines for each leg’s development. Not every branch will grow at the same pace, and that’s normal. Focus on consistent progress rather than expecting uniform results across your entire genealogy tree structure.
Creating targeted training programs based on tree structure
Your genealogy tree reveals exactly what training each team segment needs. Different positions in your network face unique challenges, and cookie-cutter training programs miss these important differences. Customized education based on tree positioning creates better results and faster development.
New recruits at the bottom levels need foundational training focused on product knowledge and basic prospecting skills. They benefit from simple, step-by-step processes they can implement immediately. Create beginner modules covering company basics, compensation plan fundamentals, and first-week action steps.
Mid-level distributors require leadership development and team-building skills. They’re often managing their first downline members and need guidance on coaching, motivation, and conflict resolution. Develop intermediate training that addresses common leadership challenges and provides practical management tools.
Top-level leaders need advanced strategies for large team management, strategic planning, and long-term vision setting. They benefit from case studies, advanced marketing techniques, and business development concepts that help them think beyond individual sales to system building.
Geographic clusters within your tree might need location-specific training addressing local market conditions, cultural considerations, or regulatory requirements. Use your genealogy tree data to identify these patterns and create relevant content.
Track training effectiveness by monitoring performance changes in different tree segments. Adjust your programs based on which approaches produce the best results for each position level. Regular feedback from team members helps refine your training offerings and keeps content relevant to actual field challenges.
The genealogy tree serves as your roadmap to MLM success, offering a clear picture of your network’s structure and growth patterns. By understanding the essential elements of tree structures and using the right software tools, you can transform complex downline relationships into actionable insights. Visual network mapping doesn’t just show you where you’ve been – it reveals untapped opportunities and helps you spot trends that could make or break your business growth.
Smart MLM leaders know that data visualization is their secret weapon. Take time to explore different genealogy tree tools and find one that matches your specific needs. Start mapping your network today, analyze the patterns you discover, and use these insights to make informed decisions about where to focus your recruiting efforts. Your future downline success depends on how well you can see and understand your current network structure.


